Adidas-Sales
Adidas Sales Analysis
Key Business Metrics Summary
This summary provides a concise overview of the core performance metrics and product insights derived from the data analysis.
Overall Data Statistics (From Descriptive Analysis)
| Metric | Value | Insight |
|---|---|---|
| Total Transactions (Count) | 9,646 | The total number of records analyzed. |
| Average Total Sales | ≈$12,457 | The average value of a single invoice/transaction. |
| Average Units Sold | ≈ 257 units | The average number of units sold per transaction. |
| Average Operating Margin | ≈42% | The overall average profitability across all sales. |
| Max Single Sale | ≈$82,500 | Highest revenue generated from a single transaction. |
PERFORMANCE SALES ANALYSIS
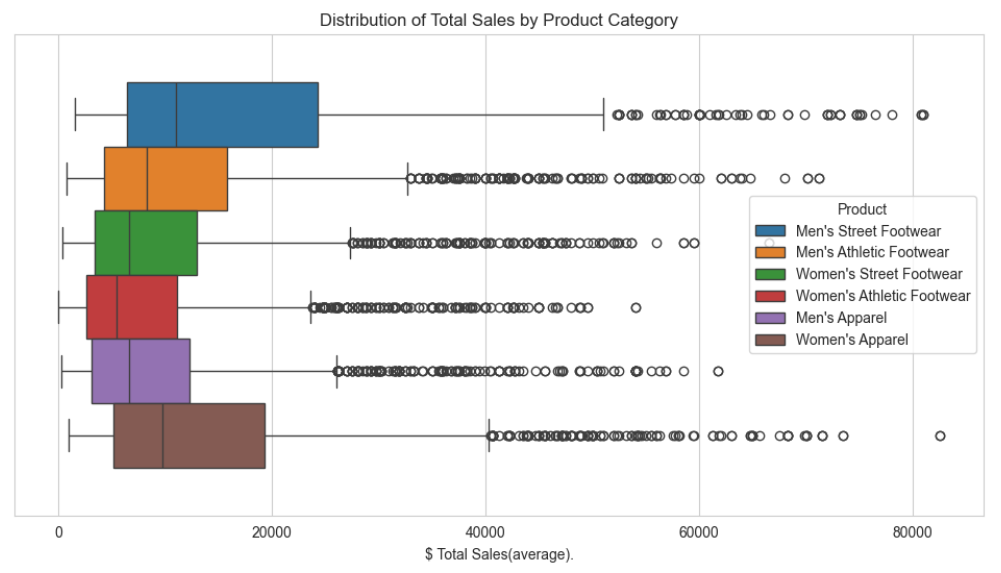
What is the revenue generated by each product category?
Insight:
-
Apparel (Red/Purple/Brown): Both Men’s and Women’s Apparel show many circles (outliers), especially Women’s Apparel with the most extreme outlier reaching over 80,000. This means Apparel sales are often driven by a few massive, unpredictable orders.
-
Footwear (Blue/Orange/Green): These categories have fewer, less extreme outliers, suggesting their revenue is based on a more consistent flow of average-sized transactions.
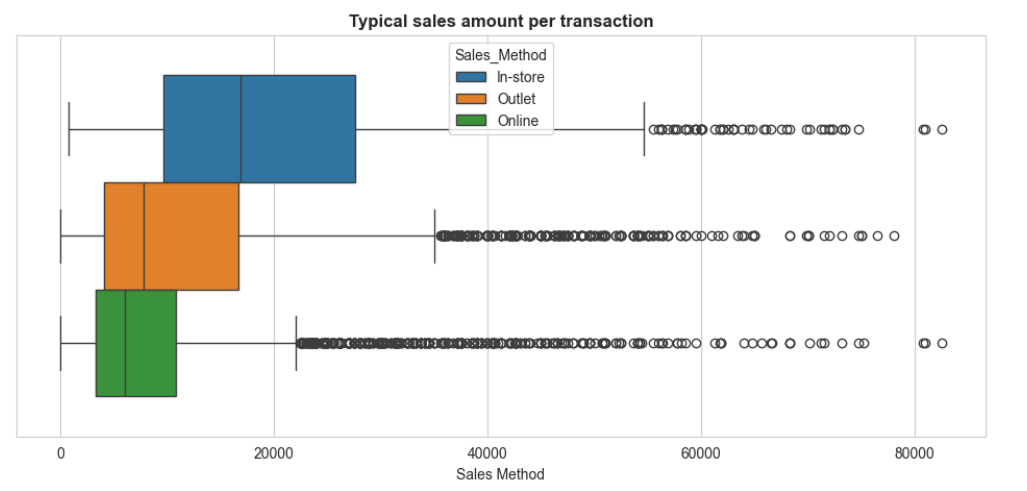
Which sales method generates and their average amount per transaction across all products?
Insight:
-
The typical In-store transaction tends to be higher than a typical Online transaction.
-
The Online method, despite having a lower typical transaction value, has a significantly higher volume (number of transactions) than In-store and Outlet to generate the highest overall total revenue.
What is the average operating margin across all product categories?
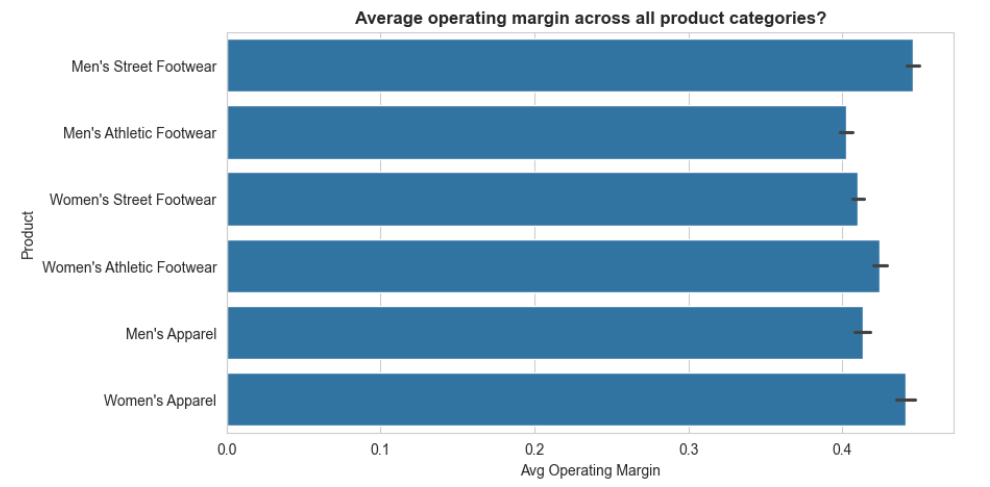
Insights: There’s no significant difference in the profitability (operating margin) when comparing the product categories. All products are highly profitable, with margins consistently around 40% to 43%.
PRODUCT SPECIFIC ANALYSIS
What is the total revenue generated from each product in the Men’s Footwear category
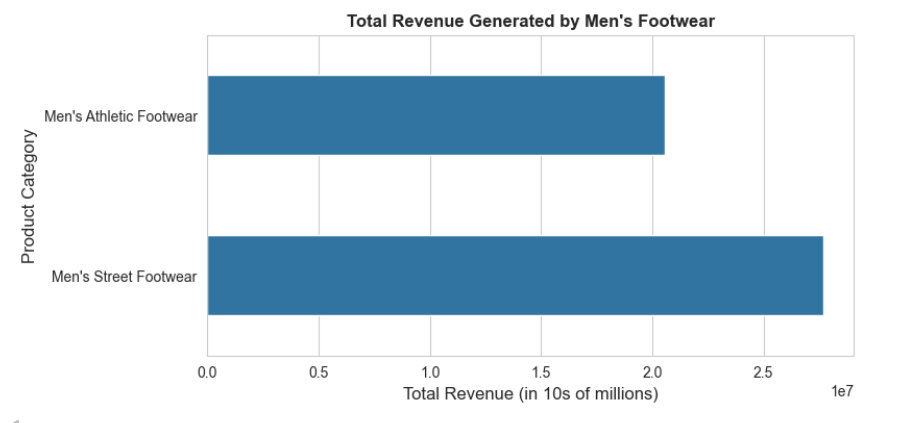
Insight Based on total revenue aggregation, Men’s Street Footwear is the top revenue generator in the Men’s Footwear category, generating about 6.5 million more in total sales than Men’s Athletic Footwear. This product line should be a focus for maximizing overall sales.
How does the performance of Women’s Athletic Footwear compare to Women’s Street Footwear in terms of sales and profit?
| Product Category | Total Revenue | Total Operating Profit | Margin Insight |
|---|---|---|---|
| Women’s Street Footwear | $17.20 Million (Higher) | $6.49 Million (Higher) | The overall stronger revenue and profit contributor. |
| Women’s Athletic Footwear | $14.31 Million (Lower) | $5.60 Million (Lower) | Slightly higher margin ($\approx$39.10%) but lacks the volume of Street Footwear. |
Insight: The company should focus on maximizing volume for the higher-revenue product (WSSF) and targeting growth for the product with better per-unit profitability (WSAF).
What is the average units sold per day for each product category?
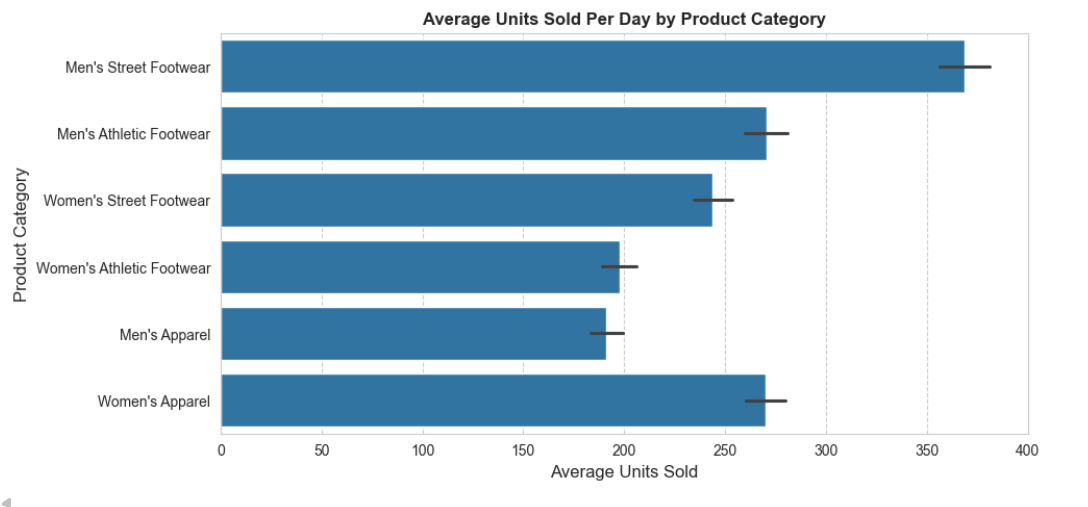
Insights:
High-Priority / High-Volume (Focus: Stockouts)
- Men’s Street Footwear: Highest priority. Implement a robust forecasting model and the largest safety stock buffer to handle peak demand fluctuations.
- Women’s Apparel: High priority. Volume is strong (270 units/day) and margins are excellent. Stock availability is paramount to maximizing total profit.
Low-Volume / High-Risk (Focus: Overstock)
- Women’s Athletic Footwear (198 units/day): Forecast Conservatively. Inventory allocation should be localized or focused on high-converting niche channels. Marketing must be targeted toward performance to drive volume.
- Men’s Apparel (191 units/day): Pull Strategy Only. Avoid building large inventory. Implement quick markdown strategies if inventory exceeds 60 Days Sales in Inventory (DSI).
REGIONAL AND TEMPORARY TRENDS
How does the total revenue change across different weeks or months?
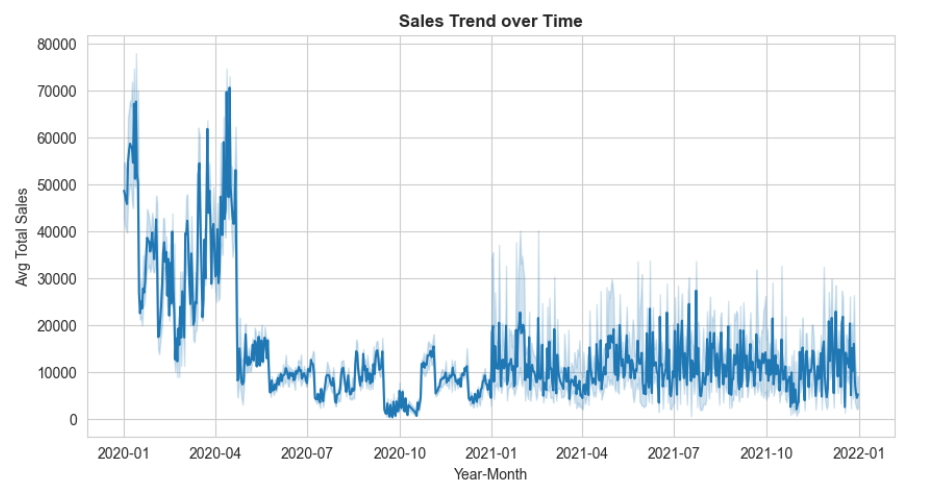
1. Sales Volatility and Initial Peak (2020)
- Significant Peak (Early 2020): The data shows a massive spike in average sales peaking around Q1 to Q2 2020. Average total sales reached up to approximately $70,000 during this period. This suggests a major event, promotion, or high-volume sales period occurred.
- Sharp Decline (Mid-2020): Following the peak, sales drop rapidly and stabilize at a much lower average (between $5,000 and $15,000) for the remainder of 2020.
2. Stability and Consistency (2021-2022)
- Stable Baseline: From 2021 onwards, the trend stabilizes at a higher baseline (between $10,000 and $25,000) compared to late 2020, indicating consistent, ongoing demand.
- Increased Volatility: While the average trend is more consistent, the wider confidence interval (the faded area) in 2021-2022 suggests greater week-to-week or month-to-month volatility in sales during the second year, requiring more agile inventory forecasting.
Insight:
The immediate drop after the early 2020 peak suggests that sales performance quickly normalized. Current forecasts should focus on the stable, but volatile, baseline established from 2021 onwards, and not the unsustainable peak seen in early 2020.
Which region contributes the most to the total sales, and does it align with the highest profitability?
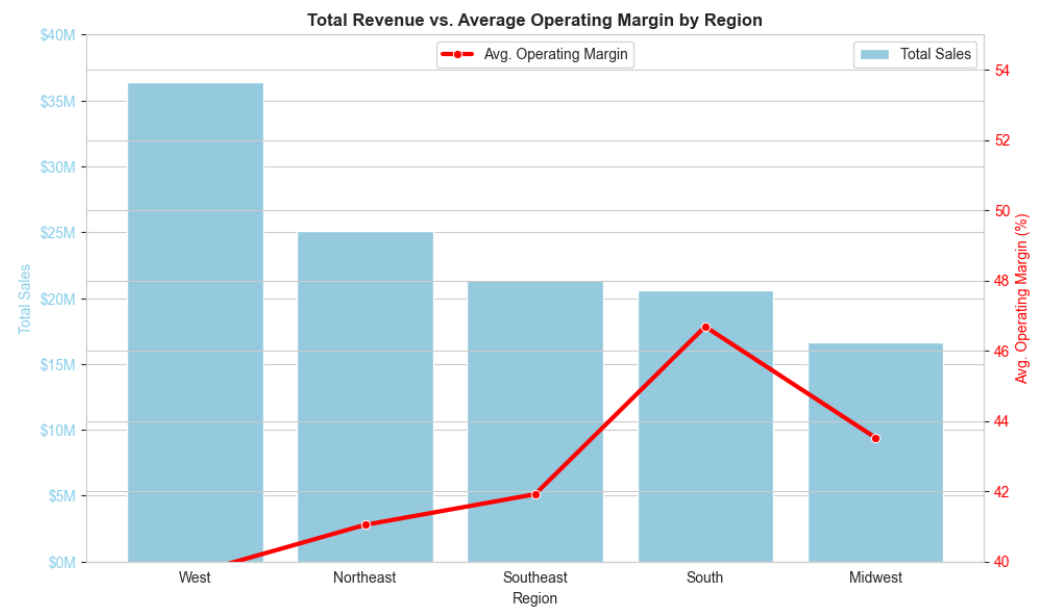
Insight:
- The South region should be the primary focus for inventory allocation due to its high demand (highest profit margin).
- The West region represents the largest opportunity for profit improvement due to its high sales potential being undercut by the lowest margin.
Final Conclusion: Data-Driven Strategy for Adidas Sales
The analysis reveals that the key to maximizing overall profit for Adidas lies in leveraging the high volume of specific categories and optimizing operational efficiency in high-margin regions, rather than solely focusing on per-unit profitability.